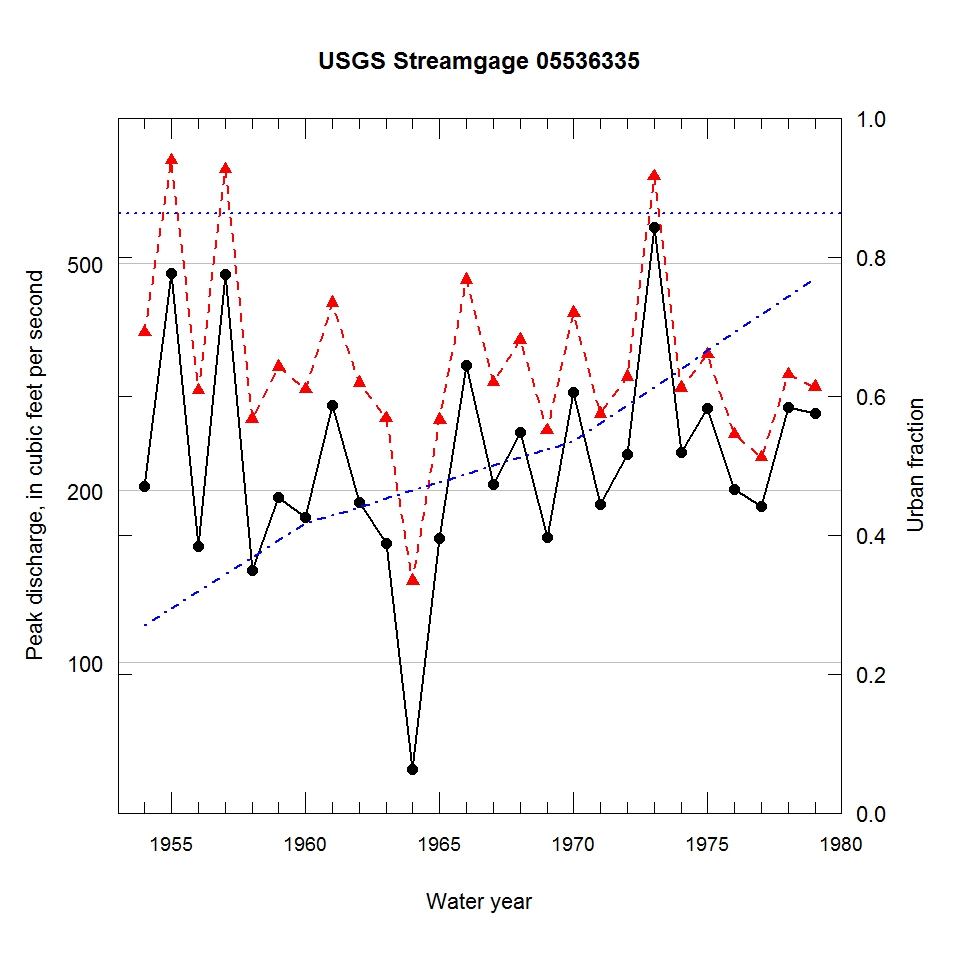
Observed and urbanization-adjusted annual maximum peak discharge and associated urban fraction and precipitation values at USGS streamgage:
05536335 MIDLOTHIAN CREEK NEAR TINLEY PARK, IL


| Water year | Segment | Discharge code | Cumulative reservoir storage (acre-feet) | Urban fraction | Precipitation (inches) | Observed peak discharge (ft3/s) | Adjusted peak discharge (ft3/s) | Exceedance probability |
| 1954 | 1 | -- | 0 | 0.270 | 1.654 | 204 | 379 | 0.355 |
| 1955 | 1 | -- | 0 | 0.294 | 3.267 | 481 | 759 | 0.032 |
| 1956 | 1 | -- | 0 | 0.319 | 1.372 | 160 | 300 | 0.585 |
| 1957 | 1 | -- | 0 | 0.343 | 2.411 | 479 | 732 | 0.037 |
| 1958 | 1 | 2 | 0 | 0.368 | 1.397 | 145 | 267 | 0.693 |
| 1959 | 1 | 2 | 0 | 0.392 | 1.258 | 195 | 330 | 0.493 |
| 1960 | 1 | 2 | 0 | 0.417 | 0.049 | 180 | 301 | 0.581 |
| 1961 | 1 | -- | 0 | 0.428 | 1.450 | 282 | 427 | 0.237 |
| 1962 | 1 | -- | 0 | 0.440 | 0.300 | 191 | 309 | 0.555 |
| 1963 | 1 | -- | 0 | 0.452 | 1.513 | 162 | 268 | 0.689 |
| 1964 | 1 | -- | 0 | 0.464 | 0.989 | 65 | 139 | 0.965 |
| 1965 | 1 | -- | 0 | 0.476 | 0.890 | 165 | 266 | 0.697 |
| 1966 | 1 | -- | 0 | 0.488 | 1.315 | 332 | 469 | 0.178 |
| 1967 | 1 | -- | 0 | 0.499 | 1.146 | 205 | 310 | 0.552 |
| 1968 | 1 | -- | 0 | 0.511 | 1.462 | 253 | 368 | 0.386 |
| 1969 | 1 | -- | 0 | 0.523 | 0.930 | 166 | 255 | 0.730 |
| 1970 | 1 | -- | 0 | 0.535 | 1.100 | 298 | 410 | 0.270 |
| 1971 | 1 | -- | 0 | 0.561 | 0.309 | 189 | 273 | 0.674 |
| 1972 | 1 | -- | 0 | 0.587 | 1.234 | 232 | 317 | 0.532 |
| 1973 | 1 | 2 | 0 | 0.613 | 1.310 | 580 | 712 | 0.040 |
| 1974 | 1 | -- | 0 | 0.639 | 1.240 | 234 | 303 | 0.575 |
| 1975 | 1 | -- | 0 | 0.665 | 0.665 | 279 | 347 | 0.447 |
| 1976 | 1 | -- | 0 | 0.691 | 0.915 | 201 | 251 | 0.745 |
| 1977 | 1 | -- | 0 | 0.717 | 1.399 | 188 | 229 | 0.805 |
| 1978 | 1 | -- | 0 | 0.743 | 1.114 | 280 | 320 | 0.522 |
| 1979 | 1 | -- | 0 | 0.769 | 0.847 | 273 | 304 | 0.571 |

